Industrial SaaS · Client work
Replacing spreadsheets with full traceability for metal 3D-printing production.
- Client
- NXG.am, Valuechain Technologies
- Role
- Product Designer (Consultant)
- Year
- 2024
- Platform
- Web dashboard
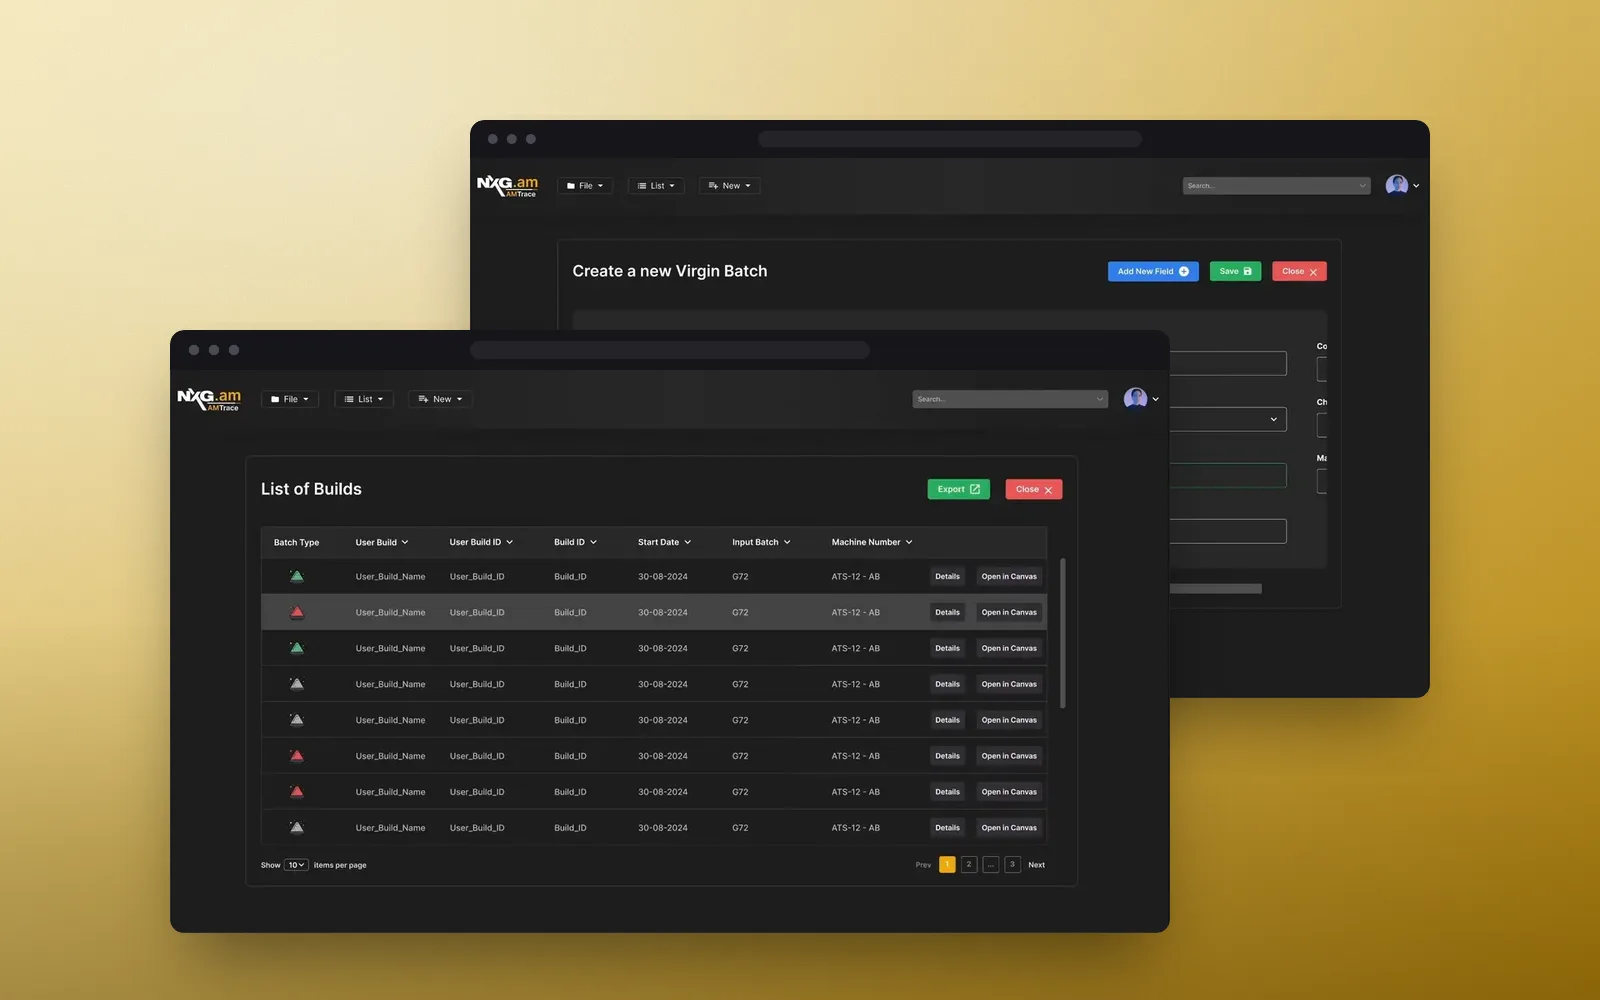
At a glance
Problem
Teams tracked powder batches and builds in Excel, which led to lost data, duplicate records and poor traceability.
Solution
AMTrace, one dashboard that logs every batch, operation and build, with visual canvas views and role-based permissions.
My role
I owned product design end to end: discovery, user research, task flows and component-level hi-fi prototypes.
Outcome
Users highlighted the simple navigation and consistent layouts. The product was still evolving when I wrote it up.
Problem
Critical production data lived in spreadsheets
In additive manufacturing, every part depends on the powder batch it was printed from. Clients logged materials and builds by hand, mostly in Excel.
Records went missing, got duplicated, and were hard to trace back when quality questions came up.
Insights
What the research showed
Traceability is the job
Teams need to link any build back to its material, operations and dates, not just store rows.
History must be findable
Past records were hard to retrieve, which made quality control slow.
Entry needs structure
Free-form sheets invited redundancy. Structured fields would keep data consistent.
Key decisions
How the design answers it
- 01
One record per batch, with everything attached
The batch form groups supplier and purchase order, identifiers, weights with a calculated final weight, sieve status, storage location and lab files in one place.
Creating a virgin batch. - 02
Every operation links back to its batch
Sieving, purchase orders and disposals each carry batch IDs, so the material history builds itself as people work.
Operations, each tied to the batches they affect. - 03
Show relationships, not just rows
A canvas maps materials and operations as connected nodes, with a timeline view for flow and a radial view for dependencies.
Timeline and radial canvas views. - 04
Permissions that match factory roles
Admins assign roles like Production Manager or Technician, then set create, edit, view and export rights per operation.
Role and user management.
Outcome
What came out of it
- Users appreciated clear navigation that let them finish tasks in few clicks.
- A consistent layout across screens helped people learn the tool quickly.
- My first project in manufacturing taught me to design for precision and audit trails first.
Want the full process? Read the original write-up on Medium(opens in a new tab).