Data dashboard · Redesign
Making a data-heavy gaming dashboard easier to read, tailor and use on a phone.
- Type
- Independent redesign
- Year
- 2025
- Platform
- Desktop, tablet, mobile
- Methods
- Personas, empathy maps, affinity mapping, user flows
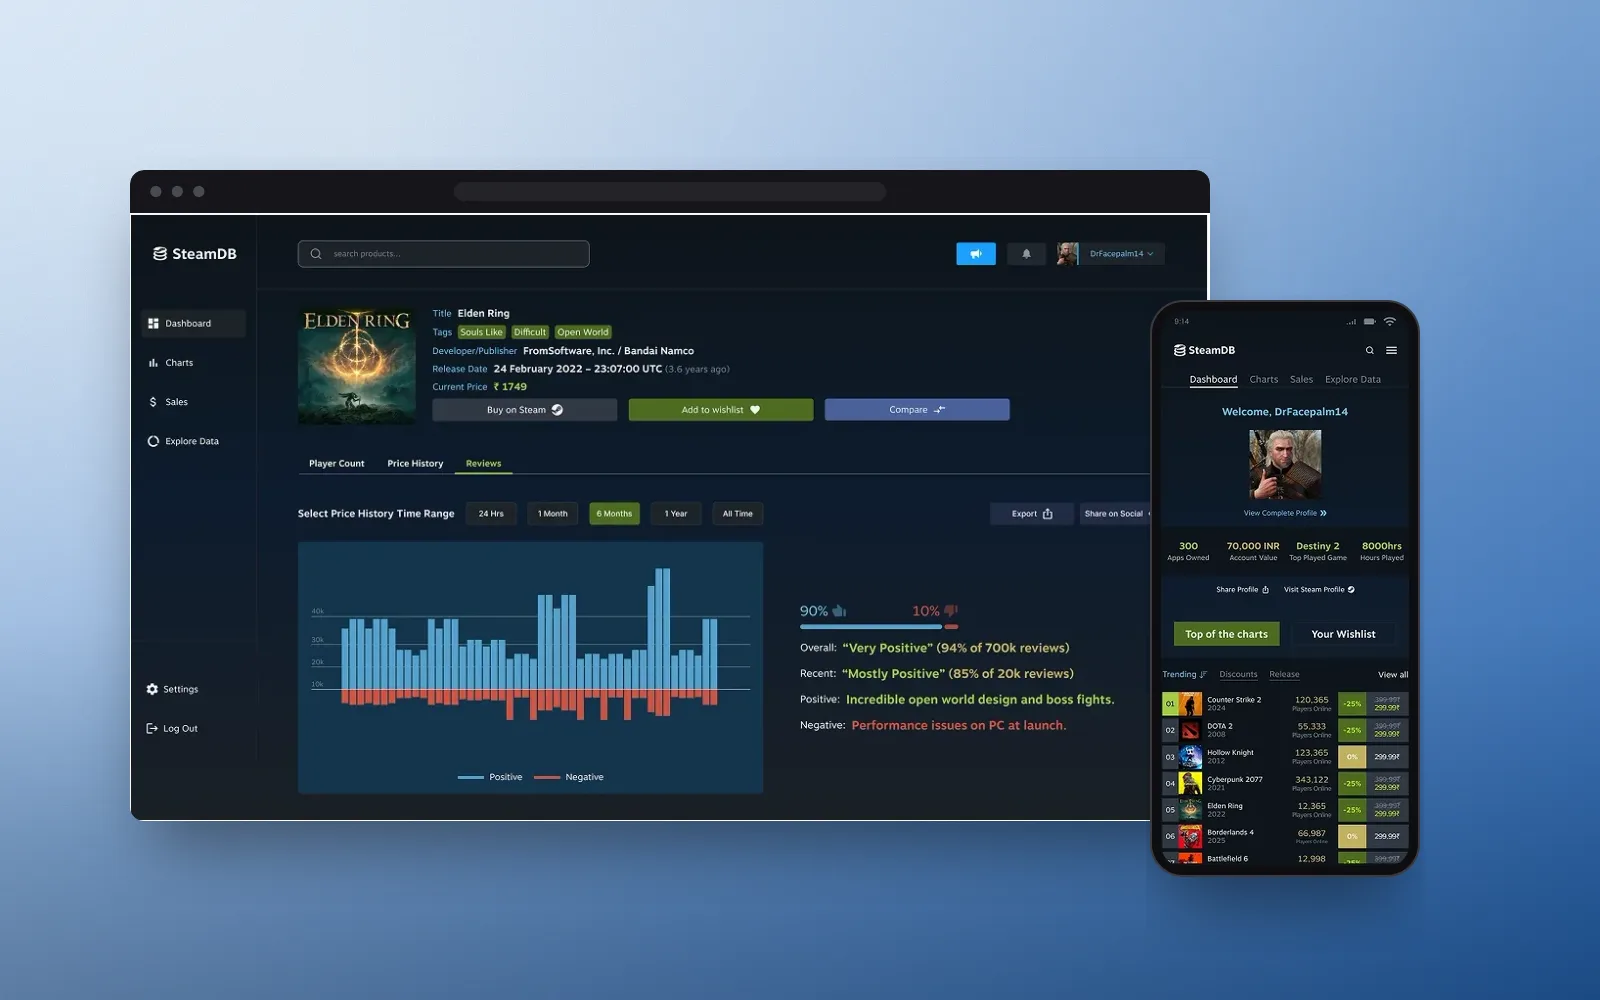
At a glance
Problem
SteamDB's data is valuable, but cluttered menus, static charts and a broken mobile layout make it slow to use.
Solution
A personal dashboard, game pages with an at-a-glance header, controllable charts with export, and a focused mobile feed.
My role
Platform audit, research synthesis, user flows, wireframes and visual design.
Outcome
A complete concept across desktop, tablet and mobile. Not affiliated with SteamDB.
Problem
Valuable data, hard to get at
Casual gamers get lost in menus, and power users like analysts and journalists can't customise timeframes, compare games or save filters. On a phone, charts and layouts break.
Insights
What the research showed
Essentials first
Both casual and professional users want key info quickly, without digging through layers.
Personal needs differ
Gamers track wishlists and deals. Journalists need exportable data on deadlines.
Everyone switches devices
Both personas move between desktop and mobile, where the experience felt most limited.
Key decisions
How the design answers it
- 01
Start with a personal dashboard
Your own stats, top charts and wishlist sit in digestible blocks, styled to match the Steam storefront.
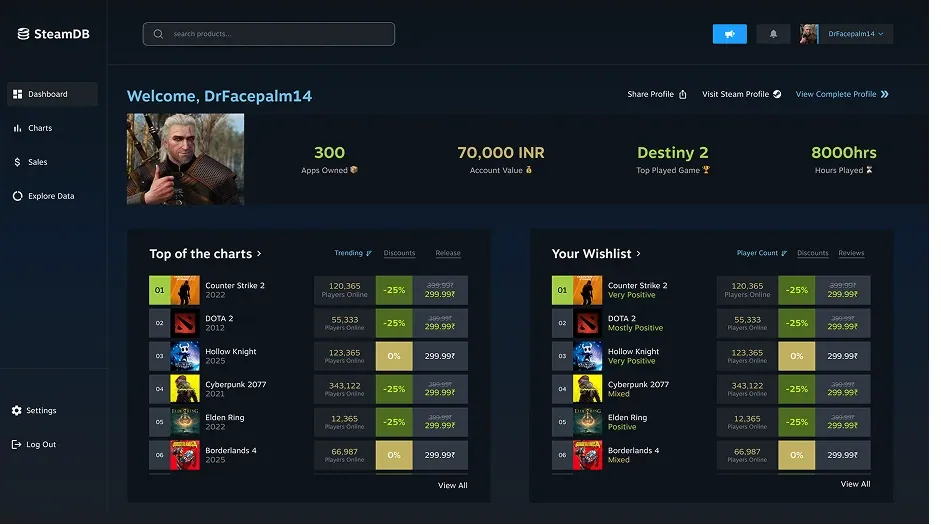
Personal stats front and centre. - 02
Charts before raw data
Concept layouts tested how charts could surface trends like player activity and price changes at a glance.
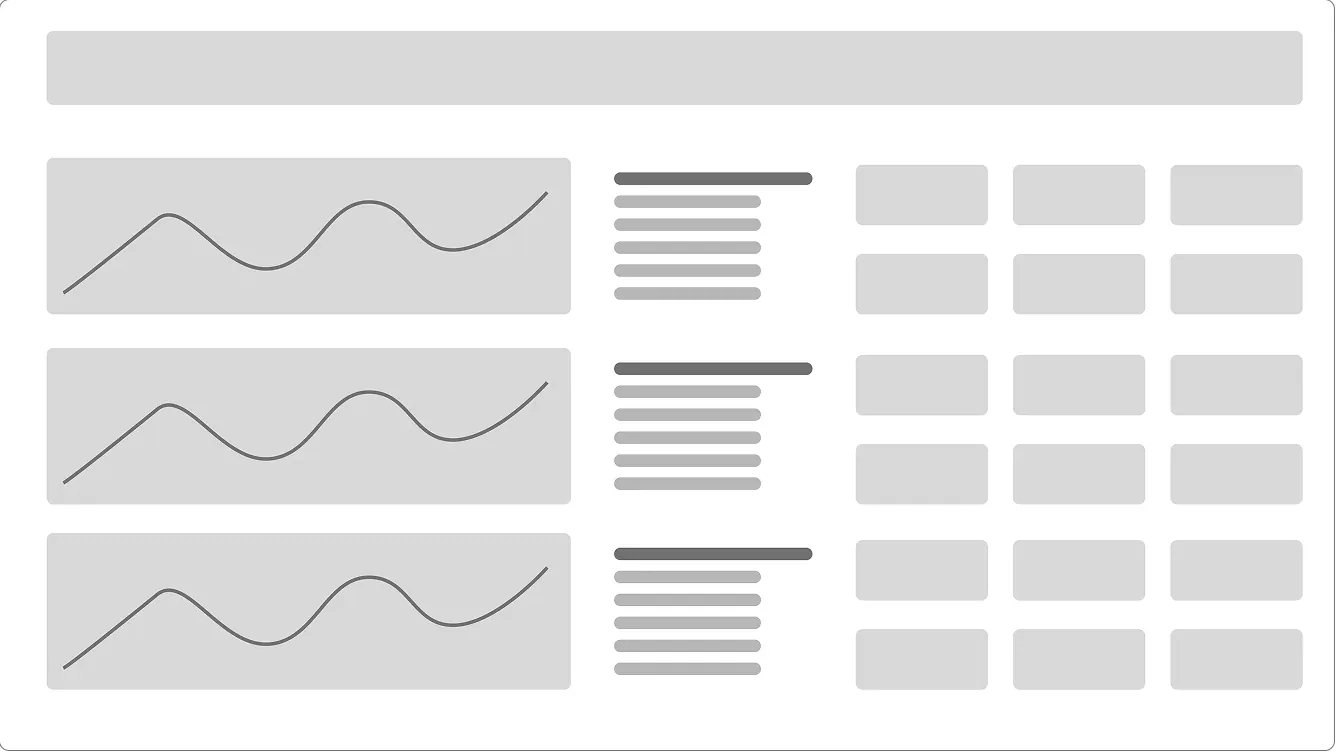
Concept layout. - 03
Charts you control
Selectable time ranges, plus export and share on every chart, so repeat tasks become one click.
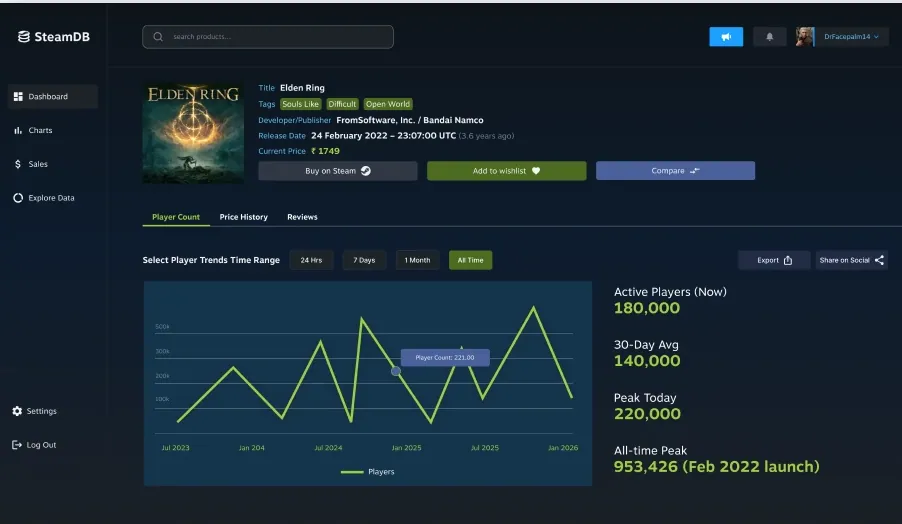
Player count with selectable time ranges. - 04
Mobile as a focused feed
On phones, the dashboard becomes a single column, and complex charts scroll horizontally instead of breaking.
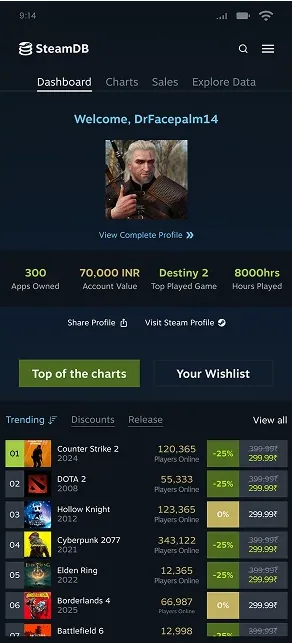
The mobile feed.
Final design
The screens
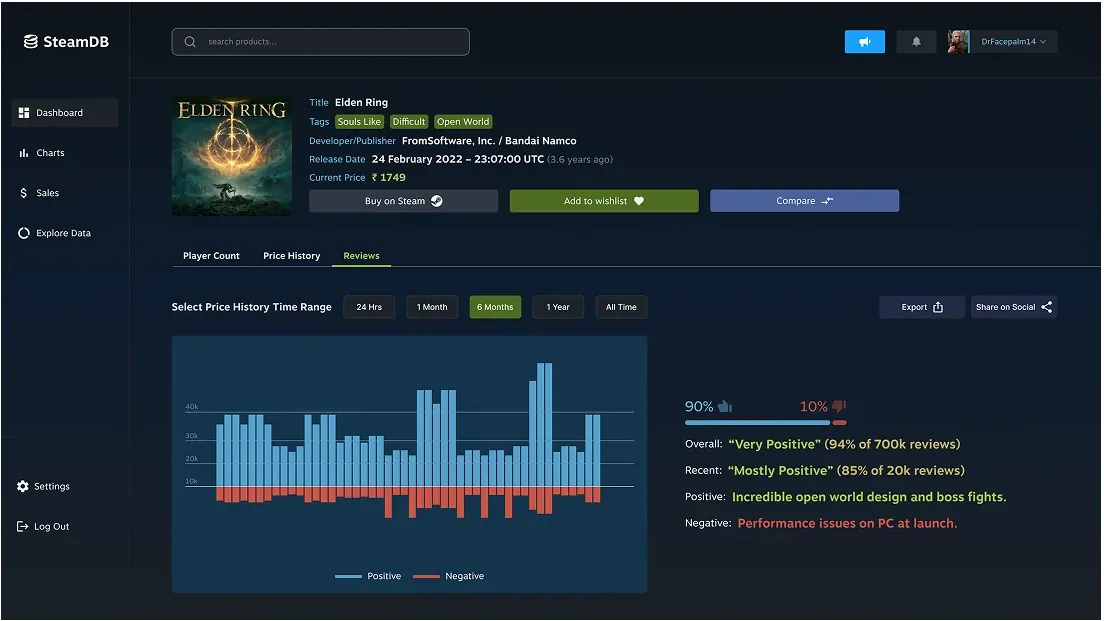
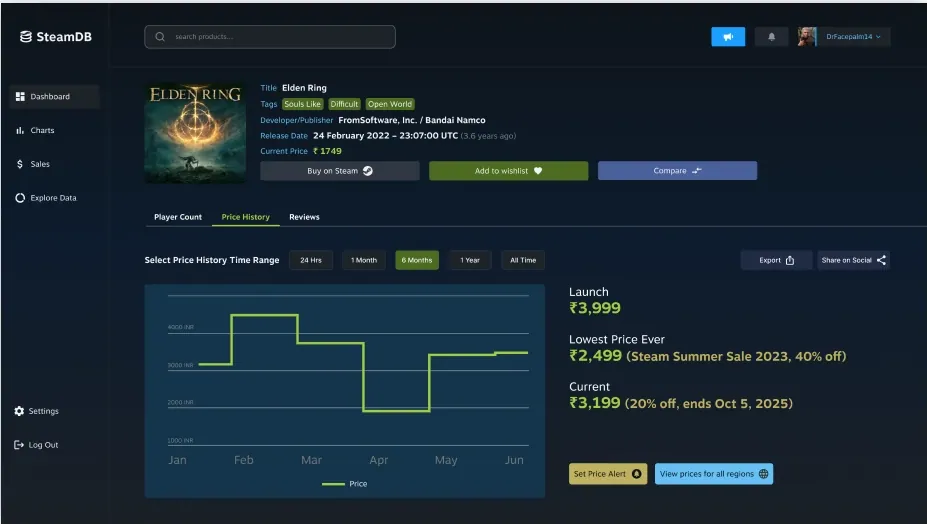
Outcome
Key flows covered
- Check wishlist discounts and buy a game.
- Compare player trends between two games.
- Save a filtered view for next time.
Want the full process? Read the full slide deck on Behance(opens in a new tab).